This is the accompanying page for the article Audio dequantization using instantaneous frequency authored by Vojtěch Kovanda and Pavel Rajmic.
We present a dequantization method that employs a phase-aware regularizer, originally successfully applied in an audio inpainting problem. The method maintains the temporal continuity of sinusoidal components in the audio signal time-frequency representation and avoids the energy loss artifacts commonly encountered with l1-based regularization approaches. The proposed method is called the Phase-Aware Audio Dequantizer (PHADQ). The methods are evaluated using the objective metric SDR and PEMO-Q ODG.
Motivation for regularizer choice
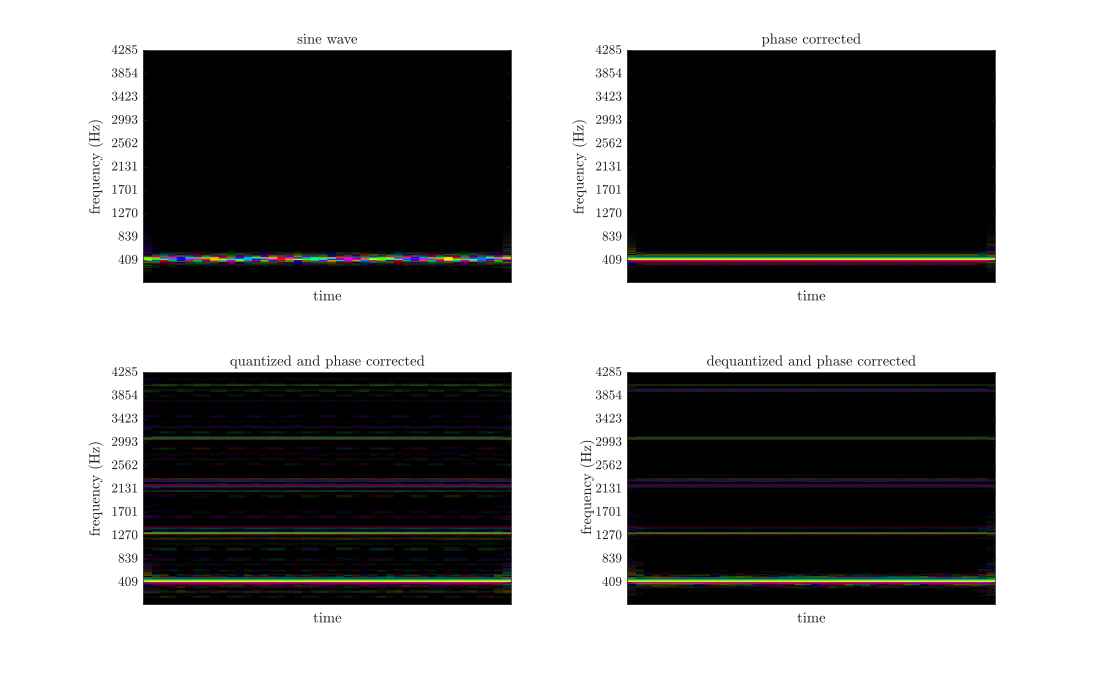
iPCTV (instantaneous phase corrected total variation) penalty function promotes sinusoidal components and, conversely, attenuates components whose phase cannot be adequately approximated as a linear function, such as noise or transients. When used for the dequantization task, the iPCTV penalty suppresses quantization noise while preserving the underlying sinusoidal structure of the signal. Following graphs illustrate how the phase of a sine wave is affected by phase correction during the quantization or dequantization process. The graphs show the phase spectrograms of the original sine wave, its 4-bit quantized version, and the corresponding dequantized signal.
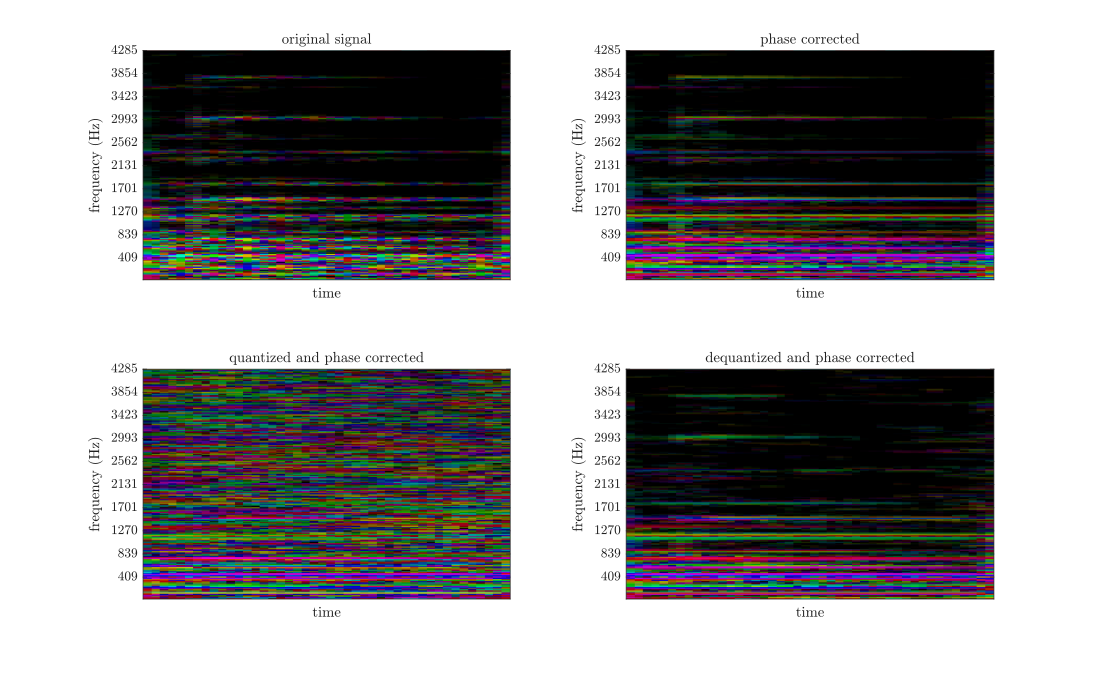
Another set of graphs shows the phase spectrograms of a harp recording segment using the same processing settings.
Audio examples
You can listen to the EBU SQAM violin audio excerpt. Other examples can be generated by running the available Matlab code. B-PHADQ (consistent/inconsistent) excerpts are generated using 60 algorithm iterations. Recordings corresponding to bit depths of 6 and 7 bps were included in the listening tests.
| Original audio | |||
6 bps |
7 bps |
8 bps |
|
| Quantized audio (quantized) | |||
| Reconst. via the CP algorithm, (CP (sparsity-based)) | |||
| Consistent variant of B-PHADQ (B-PHADQ (consistent)) | |||
| Inconsistent variant of B-PHADQ (B-PHADQ (inconsistent)) |
Listening test results
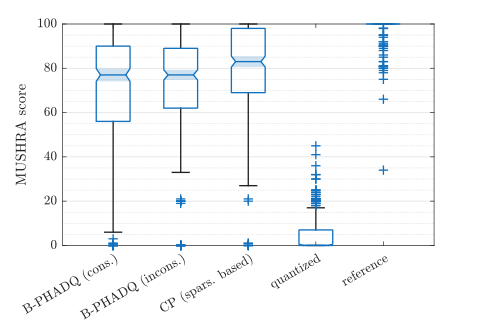
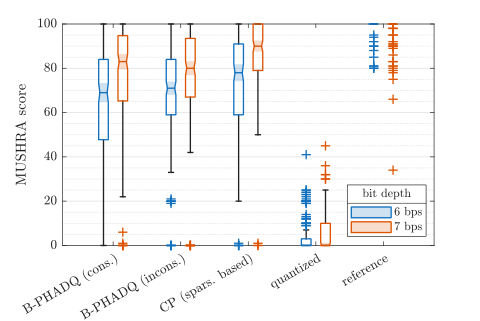
The graphs show the results of a listening MUSHRA test conducted on the EBU SQAM dataset. The test was performed using bit depths of 6 and 7 bps. The subjective listening scores confirm the trends observed in the objective metrics, supporting the validity of our evaluation. The first graph shows an agregate comparison of the methods, while the second graph breaks down the scores according to bit depth (6 and 7 bps).
Evolution of SDR and ODG over time
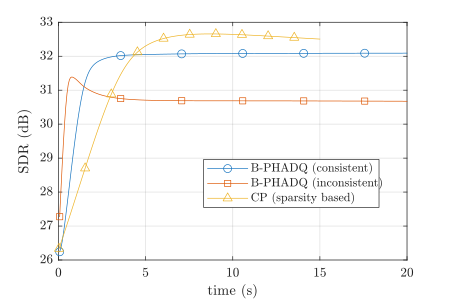
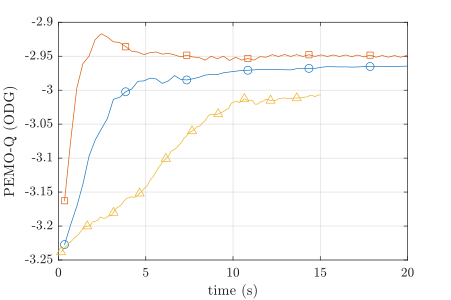
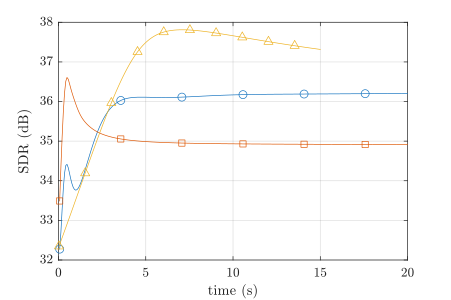
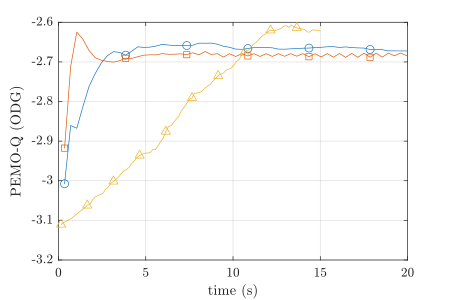
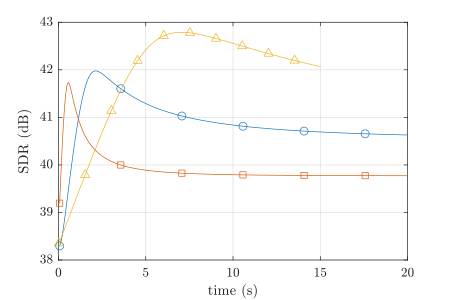
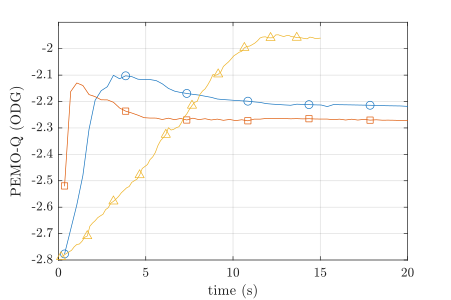
To justify the chosen number of iterations and to demonstrate the computational time of the methods, we present the following graphs, showing the evolution of average SDR and ODG over time for the EBU-SQAM dataset reconstruction at bit depths of 6, 7, and 8 bps. The markers in the graphs indicate every fiftieth iteration of the algorithm. One iteration of the CP algorithm takes approximately 0.03 s, while an iteration of any of the B-PHADQ variants takes approximately 0.07 s. The graphs show that the B-PHADQ variants reach the optimal value faster than CP. ODG values were computed every fifth iteration.
SDR |
ODG |
|
|---|---|---|
6 bps |
|
|
7 bps |
|
|
8 bps |
|
|